Wednesday, November 24, 2010

DaTa EnTrY

I. Read Bolstad Chapter 4 and answer the following questions based on the reading and lecture.


1.       Would you have more problems with feature generalization and omission in large or small scale maps? Why?
·         Large scale maps cover smaller areas which usually results in less map generalization and omission. There would be more problems with feature generalization on a small scale map because there are more fused or aggregated features. Therefore more generalization and omission occurs. The few is not as clear on a small scale map.

2.       What is snapping in the context of digitizing? Why is snapping important (i.e. what does it help avoid)?
·         Snapping is the process of automatically setting nearby points to have the same coordinates. It relies on snap tolerance or snap distance. They are used to reduce undershoots and overshoots while digitizing.

3.       What is COGO and how does it relate to coordinate surveying?
·         COGO is a coordinate geometry that it is used to calculate the station coordinates. In other words, it defines a connected set of points from the starting station to a subsequent station. IT allows the calculation of coordinate locations form open or closed transverse(a series of connected lines that have a marked beginning and ending point. This is the way most coordinate surveys are done) Distance and angle measurements are combined with trigonometric formulas to calculate coordinates. The direct entry of COGO data leads to more accurate digital database than the digitization of cartometric maps. Many errors are avoided.

EXERCISE A
Q: What is the feature class type (point, line or poly) for springs? __point________
Geocoding
Ex16C

Monday, November 8, 2010


Lab #9b
More Practice with Spatial Analysis
Geog 206: Introduction to GIS
Fall 2010
Answer the following questions using both the attribute table querying and spatial analysis skills you have developed thus far. A geodatabase containing the data you will need to answer these questions has been provided for you in the Lab 9b Data link on Moodle. You may work in groups of two to answer these questions, but please make sure you each hand in your own copy of the answers.
LA_Urban

Provinces of Canada
 1.       How many counties does the State of Iowa contain? (1 pt)
·         99
2. Which county in Georgia contains the largest number of people, as of the year 2001? (1 pt)
·         Fulton

3. How many cities, with populations between 10,000 and 49,000, are located within the State of Washington? (1 pt)
·         31

4. How many miles long are all of the interstates in Los Angeles County? (1 pt)
·         4105.56

5. Simplify the UrbanBoundaries feature class so that only the urban areas of Los Angeles County are visible (Hint: you must use one of the overlay functions). Create a new feature class and save it into the LosAngeles dataset using the name LA_Urban. Include a screenshot of this new layer with your assignment. (2 pts)

6. How many acres of urban area lie within Los Angeles County, based upon your results from question #5? ( 1 pt)
·         Sum:      1441652.796875

7. How many zip codes have their centroid in Los Angeles County? (1 pt)
·         522


8. Create a layer displaying the provinces of Canada using the data provided to you in the Canada feature dataset. Save this new layer under the Canada feature dataset using the name Provinces. Include a screenshot of this new layer with your assignment. (2 pts)
9. Which Native American Indian Reservations lie within 75 miles of the City of Thurso in Canada? (1 pt)
·         Kitigan Zibi Indian Reserve
·         Akwesasne Indian Reserve 15

10. Open your final and complete geodatabase in ArcCatalog. Make sure all of the feature datasets and feature classes are viewable. Capture a screenshot of the geodatabase and include this screenshot with your assignment. (1 pt)


Wednesday, November 3, 2010

Introduction to Spatial Analysis
Geog 206: Introduction to GIS
Fall 2010


I.                    Read Bolstad Chapter 9 (pages 295-306 only) and answer the following questions based on reading and lecture.

1.      What is spatial scope and what are the three types? The extent or area of the input data that are used in determining the values at output locations. Such spatial operations are characterized as local, neighborhood or global. 

2.      What are the two types of Algebra used in queries?  Give an example of each.

Set Algebra:
Set Algebra uses less than<, greater than>, equal to, not equal to <>,to meet certain conditions or criteria’s.These are selections by attribute.The example given above identifies features that meet certain conditions using set algebra. On the map in the bottom left corner it shows a certain criteria, which is mapping out places with an area that are >= to 1000sq feet.
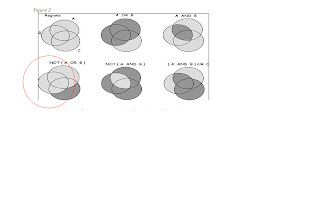
Boolean Algebra: 
What is show in figure 2 is an example of a Boolean algebra where it uses the conditions OR, AND, and NOT to select feature. The example circled above shows a type of Boolean algebra using not A or B. Meaning that the system will not choose A or B only C.


3.      What are the different types of spatial selection operations?
a.      By Attributes
1.      Set Algebra
2.      Boolean Algebra
b.      By Spatial characteristics
1.      Adjacency
2.      Containment


II.                  AFTER completing Ormsby Chapters 10 & 11, complete the following exercise.

§  Copy the Lab9a folder from Y:\courses_rmaas\Geog206\data to your working folder.
§  Open and explore the Lab9aData geodatabase.

4.   Is there a feature dataset in the geodatabase? ___yes_________
5.   What features classes are present? ___In the Los Angeles Data set we have three different feature classes. They are: PTDumeQuad, Vegetation and Wetlands. Within the personal geodatabase we have Wetlands_project._________________

Exercise 1:  Prepare (simplify) a vegetation layer for the Los Angeles region for further spatial analysis.
6.   How many features (records) exist in the Vegetation feature class in the Lab9aData.mdb geodatabase? __10896_____
§  To answer question 7, the vegetation layer needs to be simplified. Therefore, you need to dissolve the layer based on the “Covertype” field.  The resulting output feature class should be saved into the Lab9aData geodatabase and named “VegCov”. You’ll need to find the Dissolve tool based on what you’ve learned in lecture/Ormsby thus far.
7.   How many features (records) exist in the new VegCov feature class after running the dissolve operation? __9 records_____
§  The layer is still too large and unwieldy, so you need to clip it down to a smaller extent that only covers the Point Dume region.  Use the PtDumeQuad feature class to do this.  Name the output “VegCov_Clip” You’ll need to find the Clip tool based on what you’ve learned in lecture/Ormsby thus far.
8.   How many features (records) exist in the new “VegCov_Clip” feature class? ____8______

III.                Exercise 2: Generate a layer of Riverine wetlands that fall in the Point Dume quad.
§  Use the Select By Location tool to determine how many total wetlands have their centroid in the Point Dume quad.
9.   How many wetland features (records) were selected? _404____
§  Save the selected features to a 'virtual'/temporary layer using the Selection|Create layer from selected features tool.
§  Using the new layer you created, query out wetlands where the system is equal to Riverine.  (Hint: use the Systems field). 
10.   How many features (records) were selected? _123____
§  Export only these selected Riverine wetlands into a new shapefile named “Riverine_FirstInitialLastName”. Make sure to place this new shapefile inside your working directory for Lab 9a on C:/.  Ex. Riverine_rmaas.
§  Capture a screenshot (Alt PrtScr) of your final Riverine layer and paste it into this document.

Riverine

Riverine( Arc map screenshot)


Wednesday, October 27, 2010

Lab #8
Database Management & Queries
Geog 206: Introduction to GIS
Fall 2010

I. Read Bolstad Chapter 8 and answer the following questions.

1. What are the primary functions of a database management system?
·         They are computer software tools that aid in the entry, organization, analysis and distribution of data.

2. What is a one-to-one relationship between tables? A many-to-one?
·         One -to-one: It means that for every row in one table in some way it is matched to a row in another table. There is only one row in the second table that matches. 
·         One-to many: Means that one row in a table may matched many rows in the second table. We do not mean complete match though. Usually we use a column in each table to match the tables. The rows are considered to match when the matched column has the same values in both tables.  

3. Why are relational databases so popular (i.e. what are the benefits)?
·         The model is more flexible than most other designs.
·         The table structures do not restrict processing or queries.
·         Organization is simple to understand, learn and implement relative to other database designs.
·         It can accommodate a wide range of data types and is not necessary to know in advance the kind of queries, sorting and searching that will be performed on the database.


II. AFTER completing Ormsby Chapters 8 & 9, complete the following exercise.


1. You are going to join a table of landuse info to a feature class for Santa Barbara Landuse so that you can access additional information.


2. Navigate to your named folder inside the “STUDENT_DATA” folder on your C-drive. Inside of that folder, create a new folder named “Lab8”.


3. Go to the Y:\courses_rmaas\Geog206\data and copy the Lab8 folder down to your working directory.

4. Open and explore the Lab8Data geodatabase.

a. What is the Data Type of the LAND_USE field in the Landuse feature class? _______geospatial______________

b. What is the Data Type of the LAND_USE field in the LanduseInfo.dbf table? ________table____________

5. Perform the following steps in ArcMap:

a. Join the LanduseInfo.dbf file TO the Landuse feature class. Explore the table. What are the new fields that have been joined (appended)? __LU_Description, LU_Type, LU_description, Square miles and Acres.________________________________________

b. Export the Landuse feature class to a new feature class called Landuse_all to preserve the join. (hint: make sure your 'save as type' option is set correctly.)

c. Query the new feature class to select both ‘Open Lands’ and ‘Open Land Uses’ from the LU_GENERAL field.

d. Save the selection as a new feature class and place it into YOUR Lab8Data geodatabase with the name Landuse_open.

e. How many total acres of Open Lands (including Open Land Uses) exist in this new feature class? ________627________

f. Open your Lab8Data geodatabase inside ArcCatalog so that all feature classes are visible. Capture a screenshot of the geodatabase contents and post with your answers.
g. Create an area qualitative map of the Landuse_all layer using the LU_GENERAL field. Include all of your map elements (north arrow, etc.) and make sure to practice your basic map design skills. In addition, create an overview inset map on your page that provides reference for the location of this county in Southern California. Use the CountyBoundary and Highways layers for your inset. Post this map to your blog.


Friday, October 15, 2010

Making Maps For Presentation

Lab 7: Map Design & Text

Chapter 7

1. The information used for dynamic labels comes from where?
*      They come from the layer attribute. With dynamic labels you can turn the layers on and off whenever you want.

2. You are making a map of Los Angeles and have a point layer that shows all the cities in the region. However, you want to show city names for only 3 cities. What is the most efficient way to achieve this?
*      Go to the draw tool bar > click on the drop down arrow by the new text tool > on the tool palette click the label tool > locate the city you want and click to label it.

3. Can you manually adjust the position of dynamic labels?
*      No

4. Which tool needs to be selected to adjust graphics?
*      Select Elements

5. What are the two annotation types?
*      Map and Geodatabase

 Chapter 18

1. You can create your own ArcMap templates.

a. True

b. False

2. If you create a map based on an ArcMap template file (.mxt), can you save it as an .mxd file?
*      Yes
3. Describe two different ways you can access map templates.
*      Open arcmap > start using arcmap with> A template.
*      Save As on file menu> Save as type > dropdown list to Arcmap template.

4. You are adding five point graphics to your map. Instead of having to change the properties for each one after you add it, you want to set the default point symbol to a size 12 purple star. How do you do this?
You double click on the symbol then select the Star symbol and change the size/color the click OK.

5. Describe two different ways you can change the color of a graphic circle.
*      Double click the symbol and change color.
*      Right-click on the symbol.

Chapter 19

1. What is the first thing you should always do before setting up your map layout?
*      Set up page size. Go to File > Page and print set up.

2. Why is the scale different in the data view versus the layout view?
*      In layout view the orientation changes. It has it scaled up to the page sized.

3. What are three customization options available for the scale bar?
*      Scale and Units
*      Numbers and Marks
*      Format.

4. Why is it important to use the 1:1(Zoom to 100%) button?
*      This is done to evade confusion since it gives the accurate clear view of the layout page.

5. Explain how a graphic added to your data view would respond differently compared to a graphic added to the layout view when navigating around your map.
*      When you are in Data view it shows one layer at a time. In Layout view we can customize what we would like our page to like. The data view doesn’t show symbolization such as a legend, title, north arrow, and scale bar.

Part 2: Creating Thematic Maps

Q1: Choropleth maps are a type of thematic map. Define what we mean by a choropleth map.

*      Numerical data is classified into categories and the categories are shaded.
*      Polygons are often based on politically defined feature.
*      It will yield a display that puts visual emphasis on the largest area units of the map.

Q2: Read about layer files in the ArcGIS Desktop Help. Describe their benefits.
*      Layer files include all map display properties for symbolization and labeling but, layers do not usually contain actual datasets. Layer files normally reference a data source that resides in another location. This is why you need a shapefile to go along with it.

Q3: How do layer files differ from layer packages?
*      A map layer and its data contents can be saved and shared using a layer package.
*      A layer package is saved as a special file. It contains the map layer, a copy of its data, and an XML file that has a brief description of the layer.
*      Layer packages contain all the information necessary for users to put them to work in their own ArcGIS software installation.
*      They are supported in ArcMap, ArcGlobe, and ArcGIS Explorer.

*      Layer packages make it easy to share your map layer display along with the underlying data with other users.

Q4: What is the population of City of Long Beach for the year 2000?
*      46,1522

Q5: What is the population for the City of Los Angeles in 2000?
*      3,694,820

Q6: Using the ArcGIS Desktop Help, describe the three types of hyperlinks that can be created.
There are three types of hyperlinks and they have to be defined before you use the Hyperlink tool:  
*       A document: When you click a feature with the Hyperlink tool, a document or file is launched using the application with which that file type is currently associated.
*       A URL: When you click a feature with the Hyperlink tool a web page is launched in the default web browser.

*       Macro: When you click a feature with the Hyperlink tool, a value is sent to a macro. An option that lets you create customized hyperlink behavior.

Wednesday, October 6, 2010

Maps tell a story. What does this one tell you?

Symbolization and Classification
GEOG 206: Introduction to GIS
Fall 2010
I. Complete Ormsby Chapters 5 & 6 and answer the following questions.
1. In your own words, describe how symbology can be influenced by scale.
ü  Typically if you where to take a look at an area in a map with a different scale, the symbology is going to be different because if you where looking at the city of LA on a large scale map it would provide you with a lot more detail of the area and the feature would most likely show a polygon. In looking at it from a small scale map, it is covering a greater area so the symbology will be different. An example will be as a dot.
2. What are two ways (one direct and one indirect) to access a layers symbol colors so that they can be changed?
ü  Click the countries layer ->properties-> symbology tab.
ü  Double click the layer you want to symbolize to open the layer property box-> symbology tab.
3. How would you access the graduated symbols classification option?
ü  Double Click layer > layer property dialog box > symbology tab > in the show box click quantities > highlight graduated symbols.
4. What are 5 other symbology styles (in addition to ‘Conservation’) that are available to customize your features?
ü  Transportation, Hazmat, Environmental, forestry, crime analysis.

5. How could you permanently save layer symbology for use later on?
ü  The layer symology needs to be saved as a layer file. Layer files must always be sent with its shapefile for reference.
6. How can pyramids help raster data display faster?
ü   Pyramids help display your raster data faster because they provide the most appropriate level of detail. Finer resolutions are used as you zoom in.
7. How could you quickly and temporarily change a layer name to aid display in the Table of Contents?
ü  Just double click on the layer name and layer property will open up > got to the general tab > Layer name.
ü  A faster way to do it is to just right click on the layer once and wait for it to highlight .  

8. What is normalization? Dividing one attribute by anther to find the ration between them is called normalization.
 Give an example of when it would be used.
ü  Normalizing population by income. 
ü  Normalizing population by area.

9. How could dot density maps be misleading?
ü  Dot density maps reveal meaningful overall patters, but the random distribution of dots can be misleading if you focus on small areas. GIS will randomly place for example five dots randomly within the given area you tell it to. Inside such area the dots are placed randomly.